

While most investors focus on headline metrics like earnings, P/E ratios, and analyst ratings, one subtle metric quietly moves markets and can multiply returns when correctly interpreted: market breadth and accumulation-distribution signals. Historically, understanding this overlooked indicator allows investors to spot trend shifts early, enter at the right time, and achieve extraordinary returns. This article explains how to identify, interpret, and profit from this underutilized Wall Street tool.
Why Wall Street Investors Ignore This Critical Metric
Most investors obsess over conventional indicators:
- Earnings per share (EPS) growth
- P/E and PEG ratios
- Revenue beats and misses
While important, these metrics lag actual market behavior.
The overlooked metric — market breadth and accumulation-distribution patterns — measures how many stocks are participating in a move, not just the top-performing mega-cap names.
Wall Street often focuses on indices like the S&P 500 or Nasdaq Composite. But as 2024–2025 has shown, a handful of stocks can drive index gains while the majority of the market lags. Investors ignoring this metric may miss both opportunities and warning signals.
What Is Market Breadth — And Why It Matters
Market breadth measures the number of stocks advancing versus declining within a given index:
- When most stocks advance together, the rally is healthy.
- When only a few leaders push the index higher, the rally is fragile.
Consider the S&P 500: if only five stocks push the index up while 495 lag, the headline appears positive, but the underlying market is weak.
Key Breadth Metrics Include:
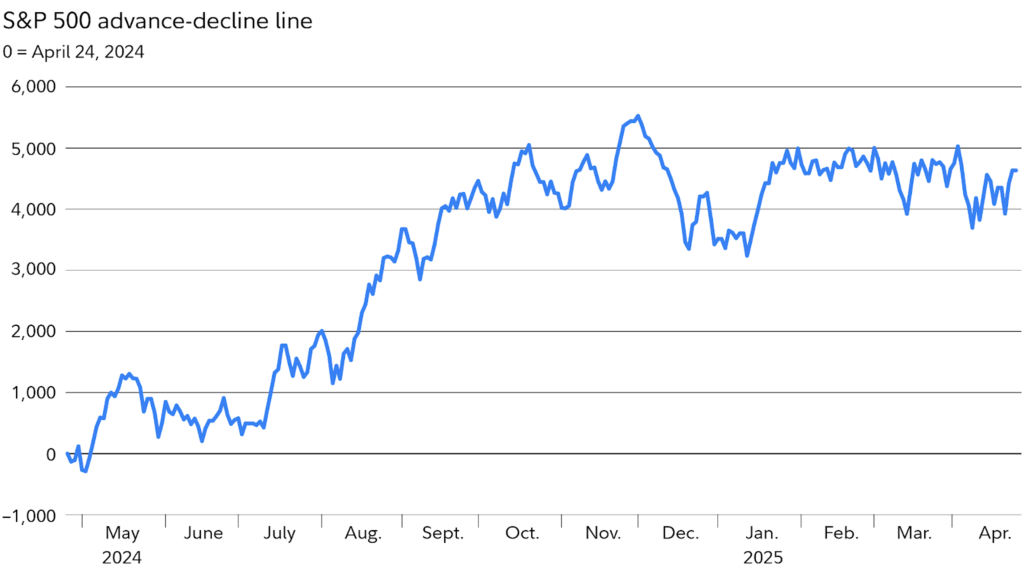
- Advance/Decline Line — difference between advancing and declining stocks
- Up/Down Volume — volume participation in up vs. down moves
- New Highs/New Lows Ratio — measures broad market health
- Accumulation/Distribution Indicator — tracks institutional buying versus selling
How This Metric Could 10× Your Returns
Mastering market breadth allows investors to:
- Spot early breakout opportunities
- Avoid narrow-led rallies
- Detect trend reversals before analysts
- Align with institutional capital flows
Real-Life Example: Tech Rotation in 2020
During the COVID-19 recovery:
- Nasdaq surged 40% by June 2020
- Market breadth showed only 30–35% of stocks participating
- Investors who noticed limited breadth avoided peak exposure
- Broader rotations in July–August yielded substantial mid-cap and small-cap gains
Accumulation-Distribution: The Secret Footprint of Institutional Investors
The accumulation/distribution indicator measures buying versus selling pressure:
- Accumulation signals strong institutional buying
- Distribution signals heavy selling
Historically, stocks showing accumulation ahead of earnings or catalysts often surge dramatically. Ignoring this metric means buying after moves, missing early returns.
How to Read Breadth Signals
Healthy Bull Market Signs
- 70% of stocks advancing
- High volume on up days
- Rising number of new highs
- Accumulation exceeding distribution
Warning Signs
- Index up, but <50% of stocks participating
- Large down days with high volume
- Distribution spikes in key sectors
Investors using breadth signals to enter broad-based rallies often achieve returns far exceeding the index.
Top Strategies to Profit Using Market Breadth
1. Enter Early in Broad Market Rallies
- Focus on sectors where most stocks are above their 50-day moving averages
2. Avoid Narrow-Led Index Moves
- If only mega-cap leaders advance, it’s a fragile rally
- Wait for broader participation before investing
3. Track Accumulation/Distribution
- Identify stocks quietly accumulated by institutions
- Accumulation often precedes strong multi-week or multi-month moves
4. Combine with Sector Rotation
- Breadth often signals which sectors are gaining institutional favor
- Rotate into those sectors early for outsized gains
5. Use ETFs for Broad Participation
- ETFs with strong underlying breadth reduce single-stock risk
- Avoid investing in narrow rallies dominated by few names
Real-Life Examples of Breadth-Driven Trades
- Russell 2000 Small-Cap Surge (2021)
- 70% of stocks participating
- Early ETF investors gained 3–5× returns by year-end
- Energy Sector Breakout (2022)
- Institutional accumulation indicated strong buying
- Mid-cap energy stocks surged 250–400%
- Healthcare Rebound (2023)
- Breadth indicated broad recovery
- Multi-cap healthcare ETFs outperformed S&P 500 by ~60%
10+ Frequently Asked Questions (FAQs)
1. What is market breadth?
Market breadth measures the number of stocks advancing versus declining, indicating the health of a rally.
2. Why is it overlooked?
Many investors focus only on headline index gains, missing subtle participation signals.
3. How does accumulation/distribution work?
It tracks institutional buying (accumulation) versus selling (distribution) at the stock or sector level.
4. Can breadth predict market crashes?
Yes. Narrow-led rallies often precede reversals.
5. Is this metric useful for all types of investors?
Yes — retail and institutional investors use it to gauge trend strength and position risk.
6. Which tools track market breadth?
- Advance/Decline Line
- Up/Down Volume
- New Highs/New Lows Ratio
- Accumulation/Distribution Indicator
7. How can this metric generate outsized returns?
By entering broad-based rallies early and avoiding narrow-led moves, investors can capture multi-fold gains.
8. Does it work for individual stocks?
Yes — sector and stock-level breadth reveal accumulation and selling pressure.
9. Are ETFs useful in applying this strategy?
Absolutely — broad ETFs provide exposure to a wider base of stocks, reducing risk from narrow rallies.
10. How often should market breadth be monitored?
Daily or weekly, especially before major economic announcements.
11. Can it signal opportunities in bear markets?
Yes — breadth highlights early recovery signals and sector rotations, even in down markets.
Key Takeaways
- Market breadth is the most overlooked metric on Wall Street, predicting trends before earnings or analyst reports.
- Understanding accumulation/distribution helps investors enter rallies early and avoid false moves.
- Historical examples show breadth-driven strategies can yield 3–10× returns.
- Combine breadth analysis with sector rotation and institutional flow data for maximum gain.